Image
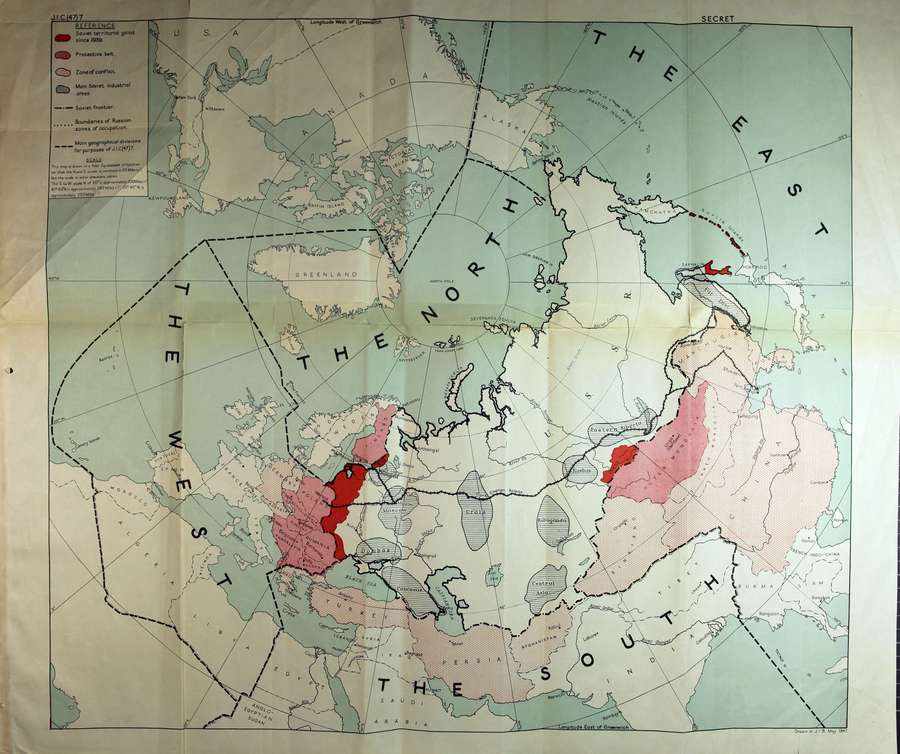
British map showing Soviet territorial gains 1939-1947
Map of the Northern Hemisphere with the North Pole at its centre and several territories marked in different shades of red.
Transcript
REFERENCE
[Red] = Soviet territorial gains since 1939.
[Light red] = Protective belt
[Dotted (lightest red)] = Zone of conflict.
[Striped (blue)] = Main Soviet industrial areas.
[Line with dashes and dots] = Soviet frontier
[Dotted line] = Boundaries of Russian zones of occupation
[Dashed line] = Main geographical divisions for purposes of J.I.C.(47)7.
SCALE
This map is drawn on a Polar Equidistant, projection so that the N. and S. scale is constant at 305 Miles to 1°, but the scale in other directions varies.
The E. to W. scale N. of 60° is approximately 300 Miles to 1°, 40°-60° N. is approximately 280 Miles to 1°, 20°-40° is approximately 250 Miles to 1°.
Technical details
- Format
-
image/jpeg - Width
- 900px
- Height
- 754px