Main section
The Local Authority Benchmarking Exercise 2023 provided services across the country with a chance to compare and contrast with other services, with data available on subjects such as digital holdings and exhibition attendance.
The Local Authority Archive Benchmarking Exercise replaces the annual Archive Services Statistics Survey run by the Chartered Institute of Public Finance and Accountancy (CIPFA). Most of the questions in the benchmarking exercise remained unchanged from the CIPFA abbreviated survey. After consultation with former members of the CIPFA Archive Working Party and the Chief Archivists in Local Government Group (CALGG) some questions were updated.
This online benchmarking exercise was opened to all 126 English and Welsh local authority archives services on Monday 14 November 2022 and closed on 28 February 2023. Seventy English and five Welsh archive services contributed data to the exercise.
The benchmarking data is arranged according to the Office of National Statistics English regions: South East, South West, London, North East, North West, Yorkshire and The Humber, East of England, with the East and West Midlands combined as one to form the Midlands and Wales.
Tabs Navigation
Tabs
Executive summary
Below is a summary of the overall response to the benchmarking exercise. The next tab, Graph data, provides a visual representation of each point in turn.
- 58% of local authority archive services in England and Wales participated in the Local Authority Archive Benchmarking Exercise. (Figure 1)
- The average number of volunteers working in archives across all regions is 29. Volunteers each work on average 53 hours per year. Three regions: South West, South East, Midlands and North West are above the national average. (Figure 2)
- The national average of archive holdings is 1050m3. Archive holdings in the East are significantly above the national average at 1779m3. (Figure 3)
- Nationally 80% of archive holdings are stored in conditions that conform to BS4971. London has the lowest average of archives services that store their holdings in conditions that conform to BS4971, at 51%. (Figure 4)
- Archive services in London are open more than 60 hours per week and have the highest average of out of hours opening times. (Figure 5)
- Nationally there is little variation in the number of visits to archives only (1026) except in the South West, which had the highest visitor average (1554 visitors) and Wales the lowest (572). (Figure 6)
- On average 12% of archive holdings across all regions are not covered by a finding aid. Nationally only 60% of collections are covered by any type of finding aid. On average archive services in Wales have an above average 76% of their archival holdings covered by finding aids. (Figure 7)
- Archives in most regions have preferred bespoke software to preserve born-digital records, with the exception of institutions in the South East, where there is a strong preference for Preservica. (Figure 8)
- The South West has the highest average of OAIS conforming born-digital records, closely followed by London. (Figure 9)
- On average, online learning events particularly those related to archives only, were much better attended than in-person learning events. (Figures 10 and 11)
- There is significant regional difference in social media engagement, with London, the North East and East having a strong Twitter following, but Wales and Yorkshire engaging more on Facebook. (Figures 12 and 13)
- Archive services in Yorkshire generate the highest average income and highest expenditure. Services in the South East region on average have the lowest income and lowest expenditure. (Figure 14)
Graph data
Participation
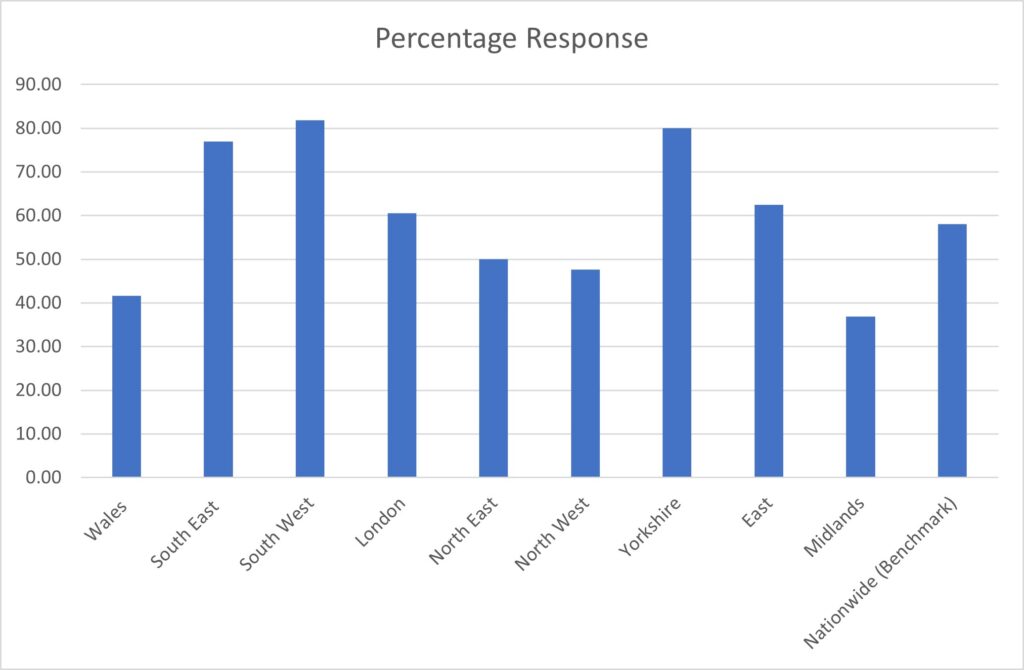
Figure 1
Staffing and Human Resources
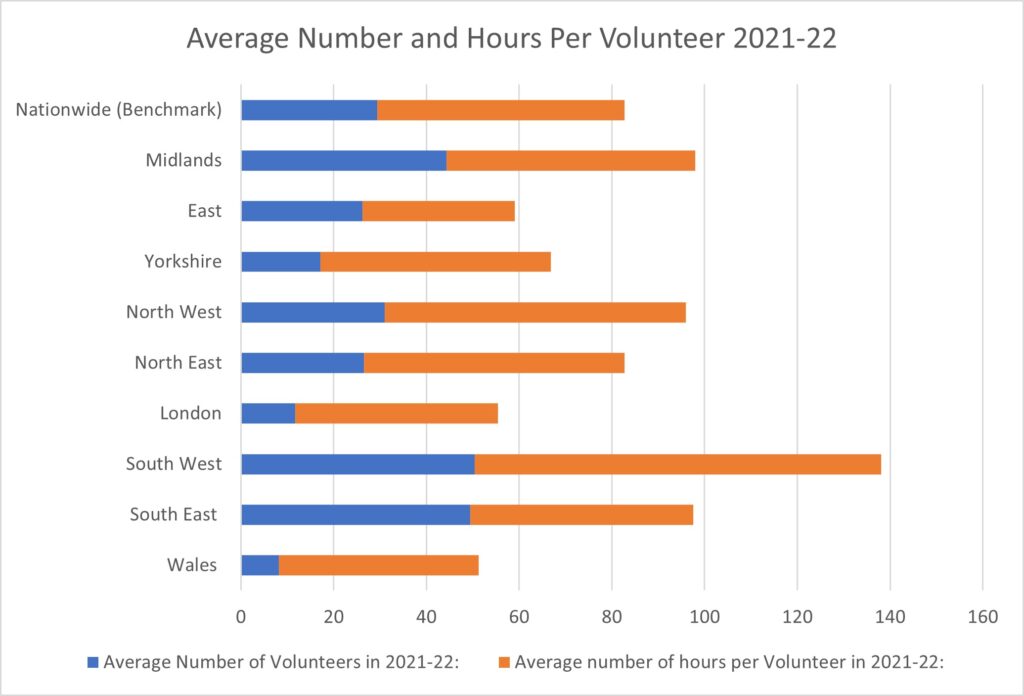
Figure 2
Holdings
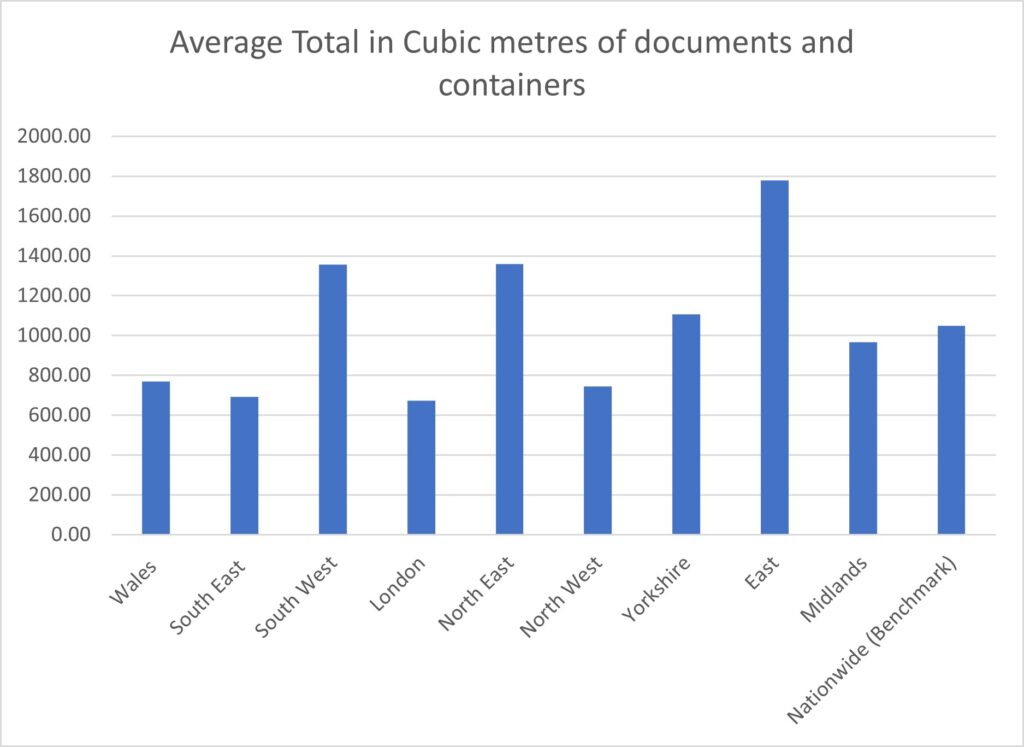
Figure 3
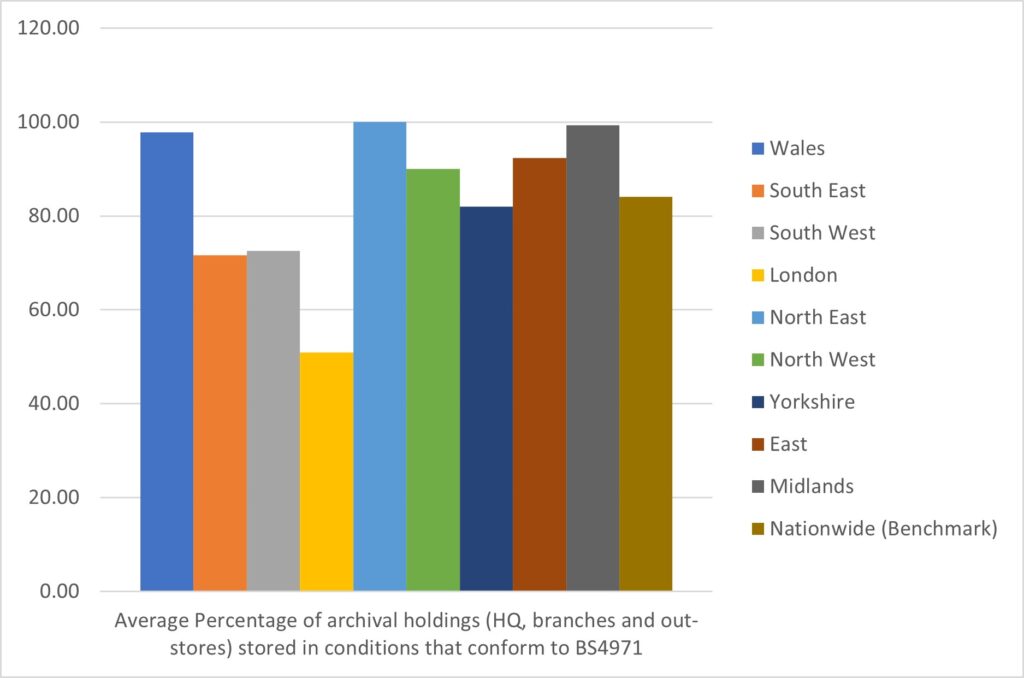
Figure 4
Access and accessibility
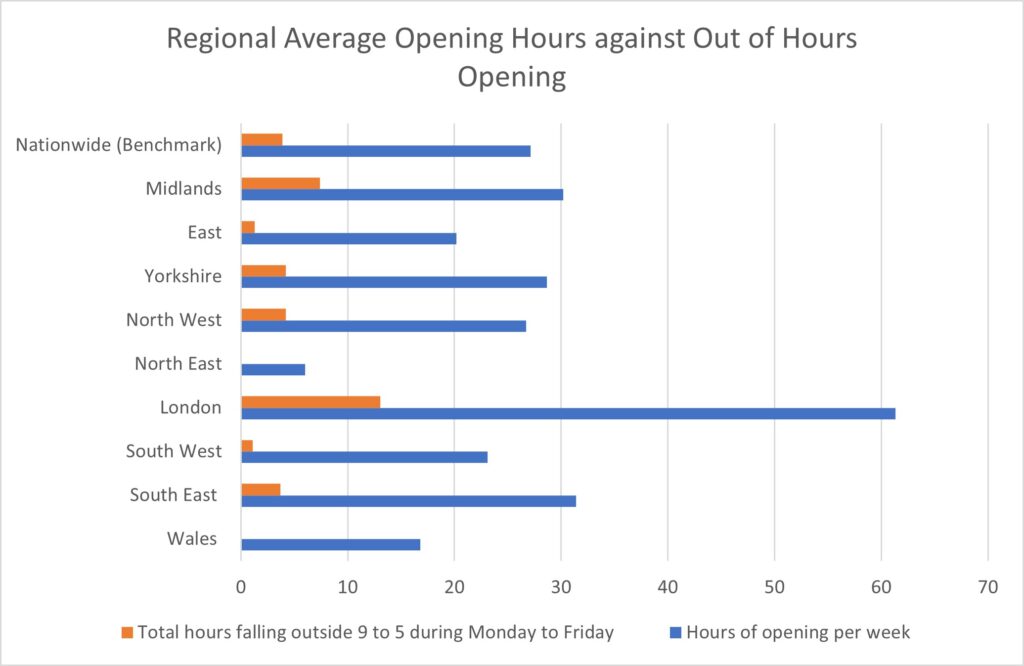
Figure 5
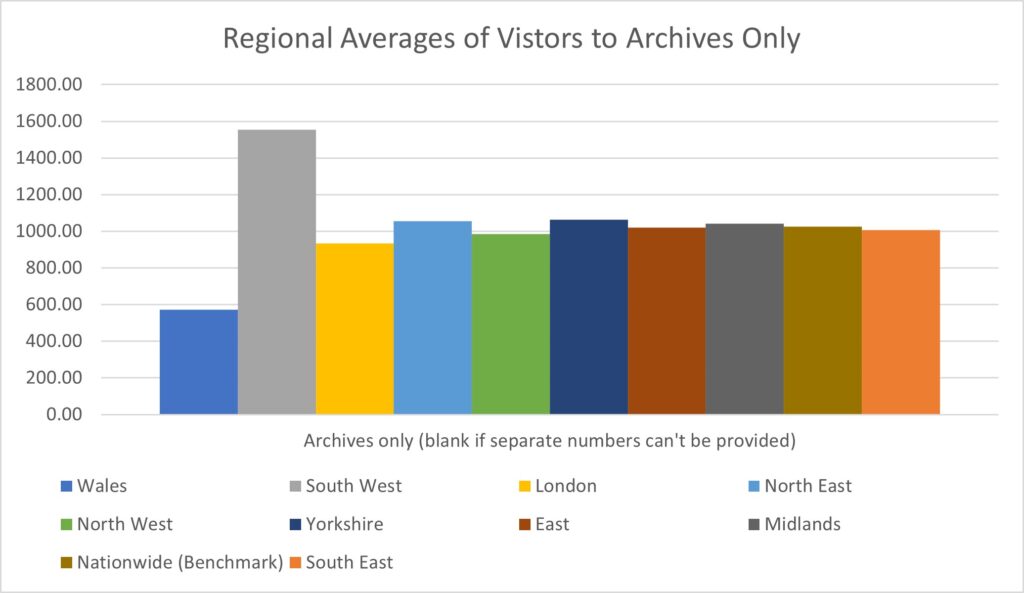
Figure 6
Finding aids
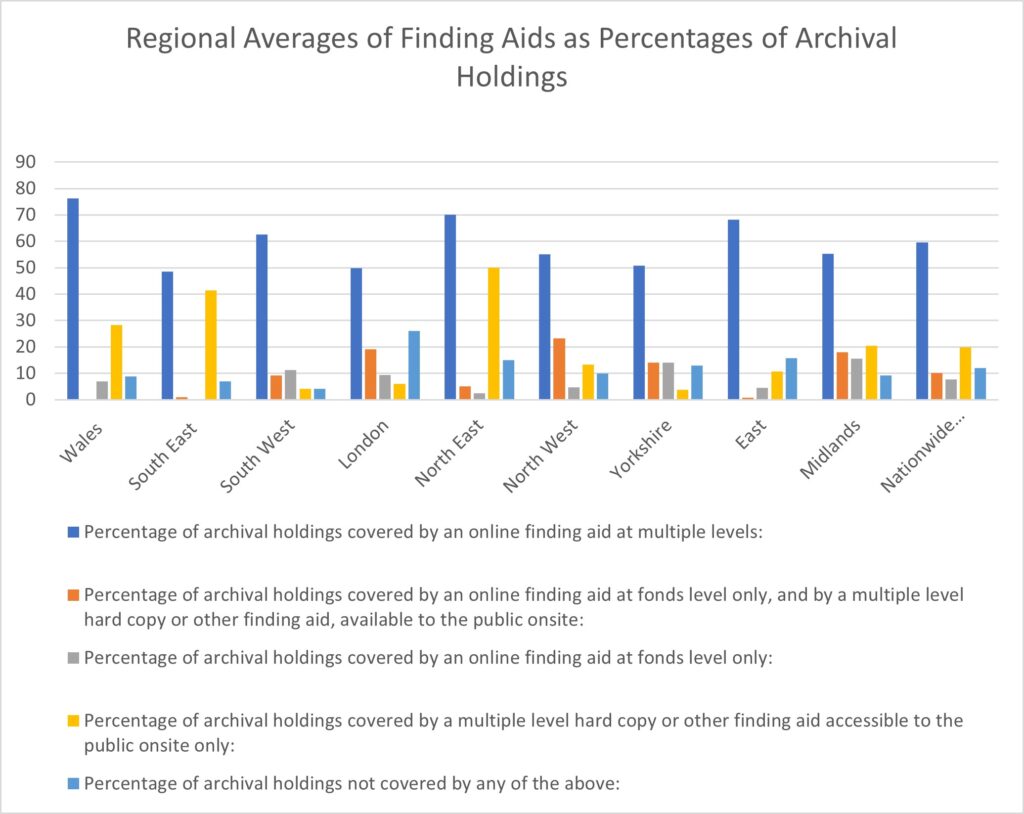
Figure 7
Digital holdings
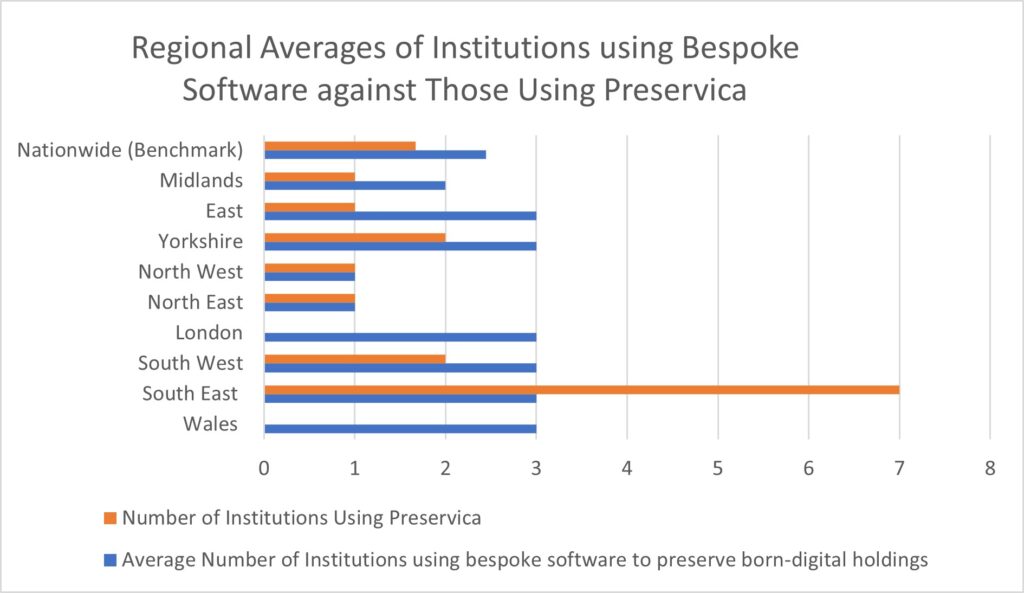
Figure 8
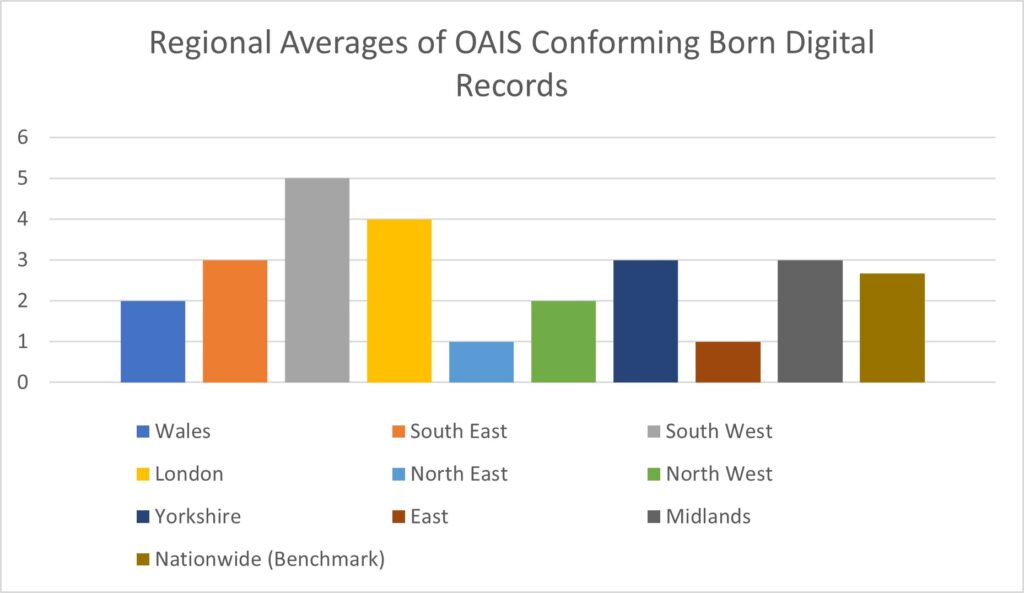
Figure 9
Events and exhibitions
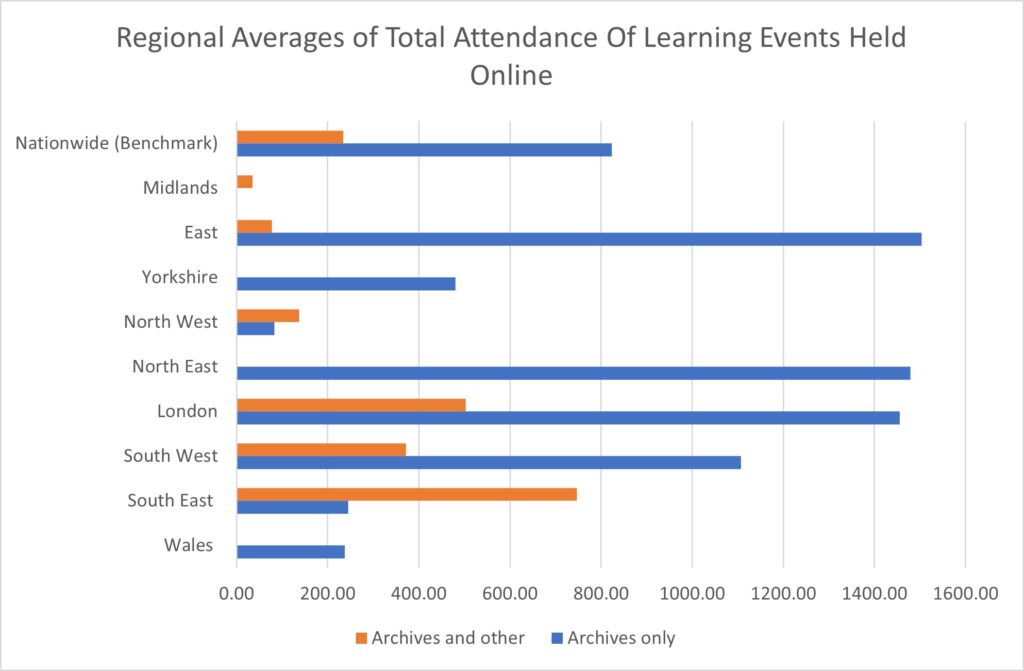
Figure 10
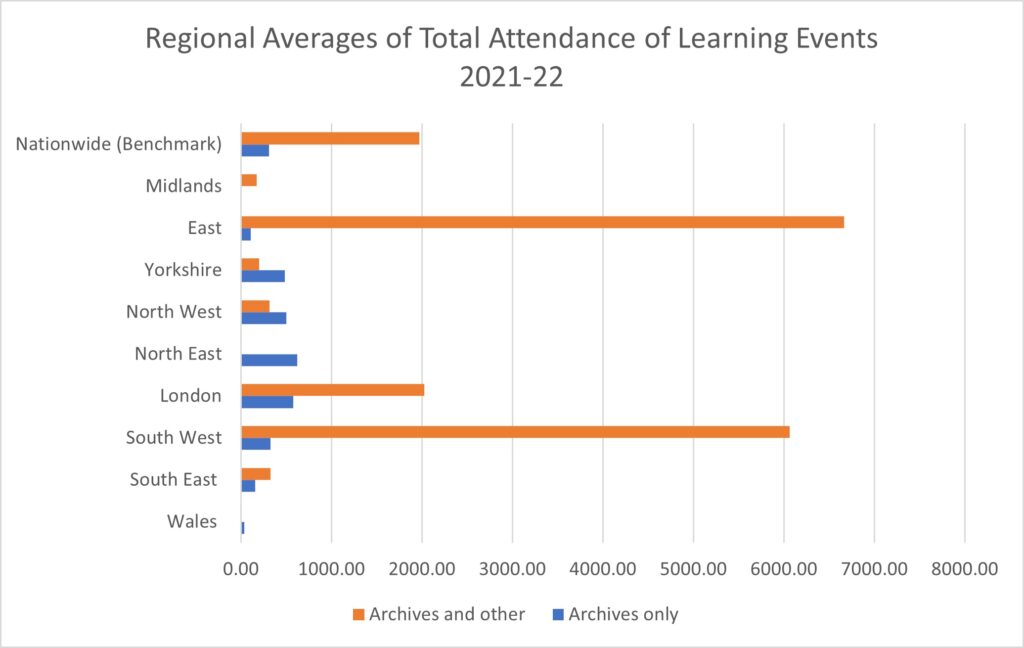
Figure 11
Outreach and social media
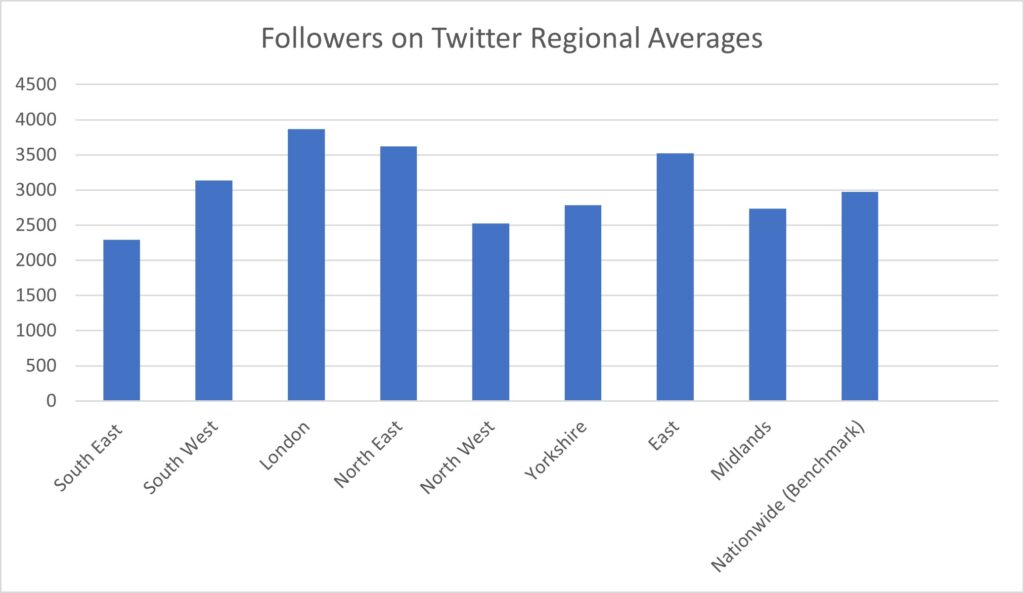
Figure 12
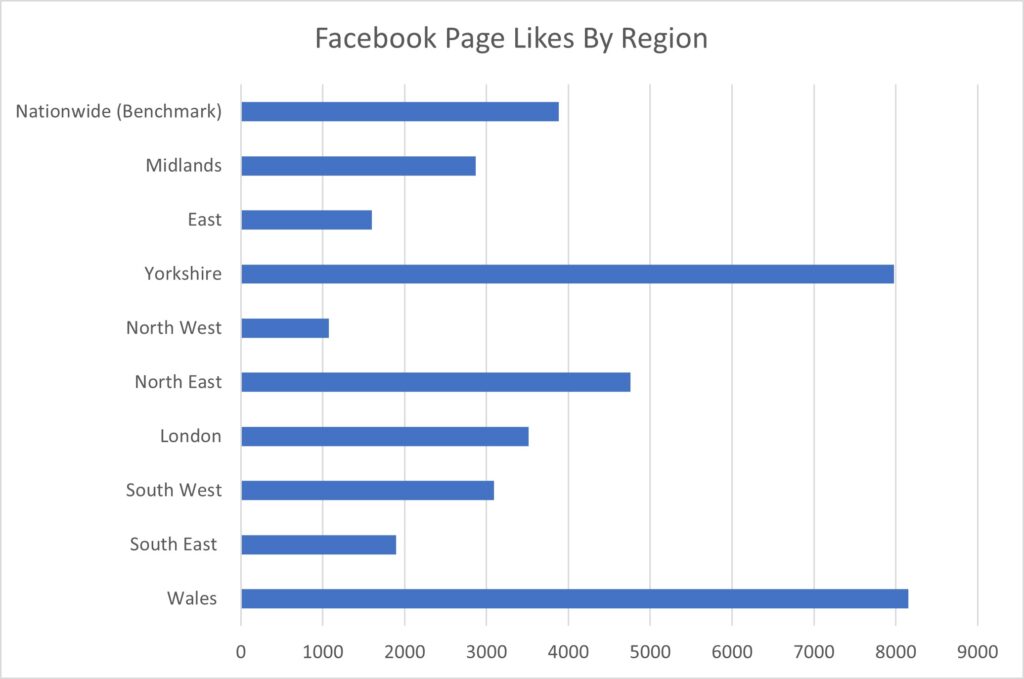
Figure 13
Finance
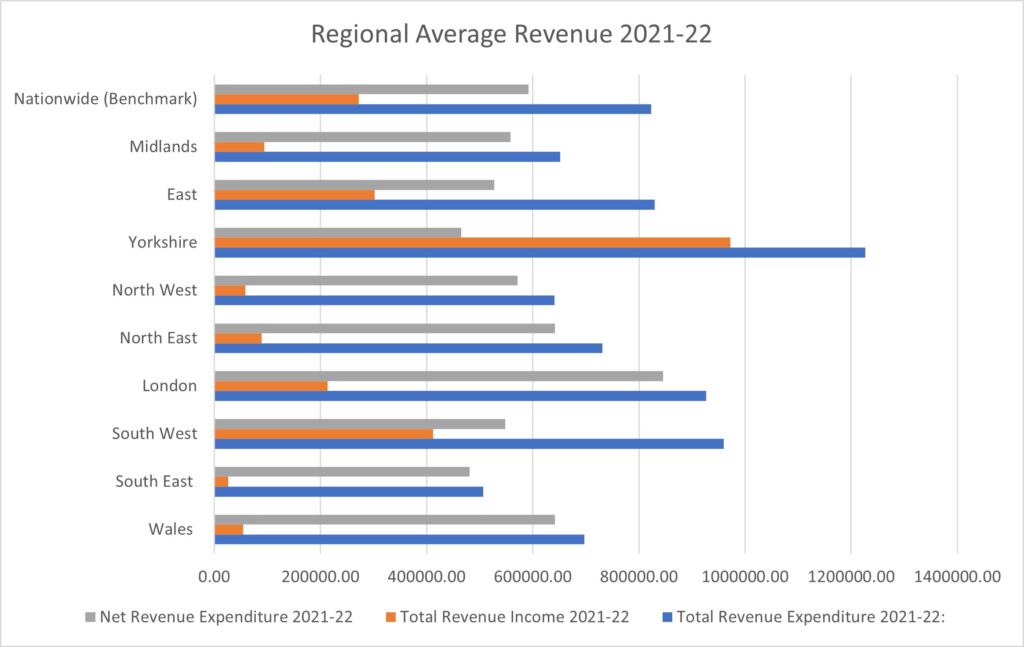
Figure 14